📊 Data Science Visualizations
Welcome to my Data Science Visualizations Portfolio 🎨.
These plots were created as part of the course DS200 Research Methods, where I explored open datasets using Python (Matplotlib).
The full analysis and code are available in my GitHub Repository.
🗂 Dataset
- Title: District wise Number of Schools, Student Enrollment and Pass Percentage (Class X & XII), Delhi (2023-24)
- Source: Government of India Open Data Platform
- Format: CSV
- License: Government Open Data License – India (GODL)
📈 Visualizations & Findings
🔹 Scatter Plot — Enrollment vs Pass Percentage
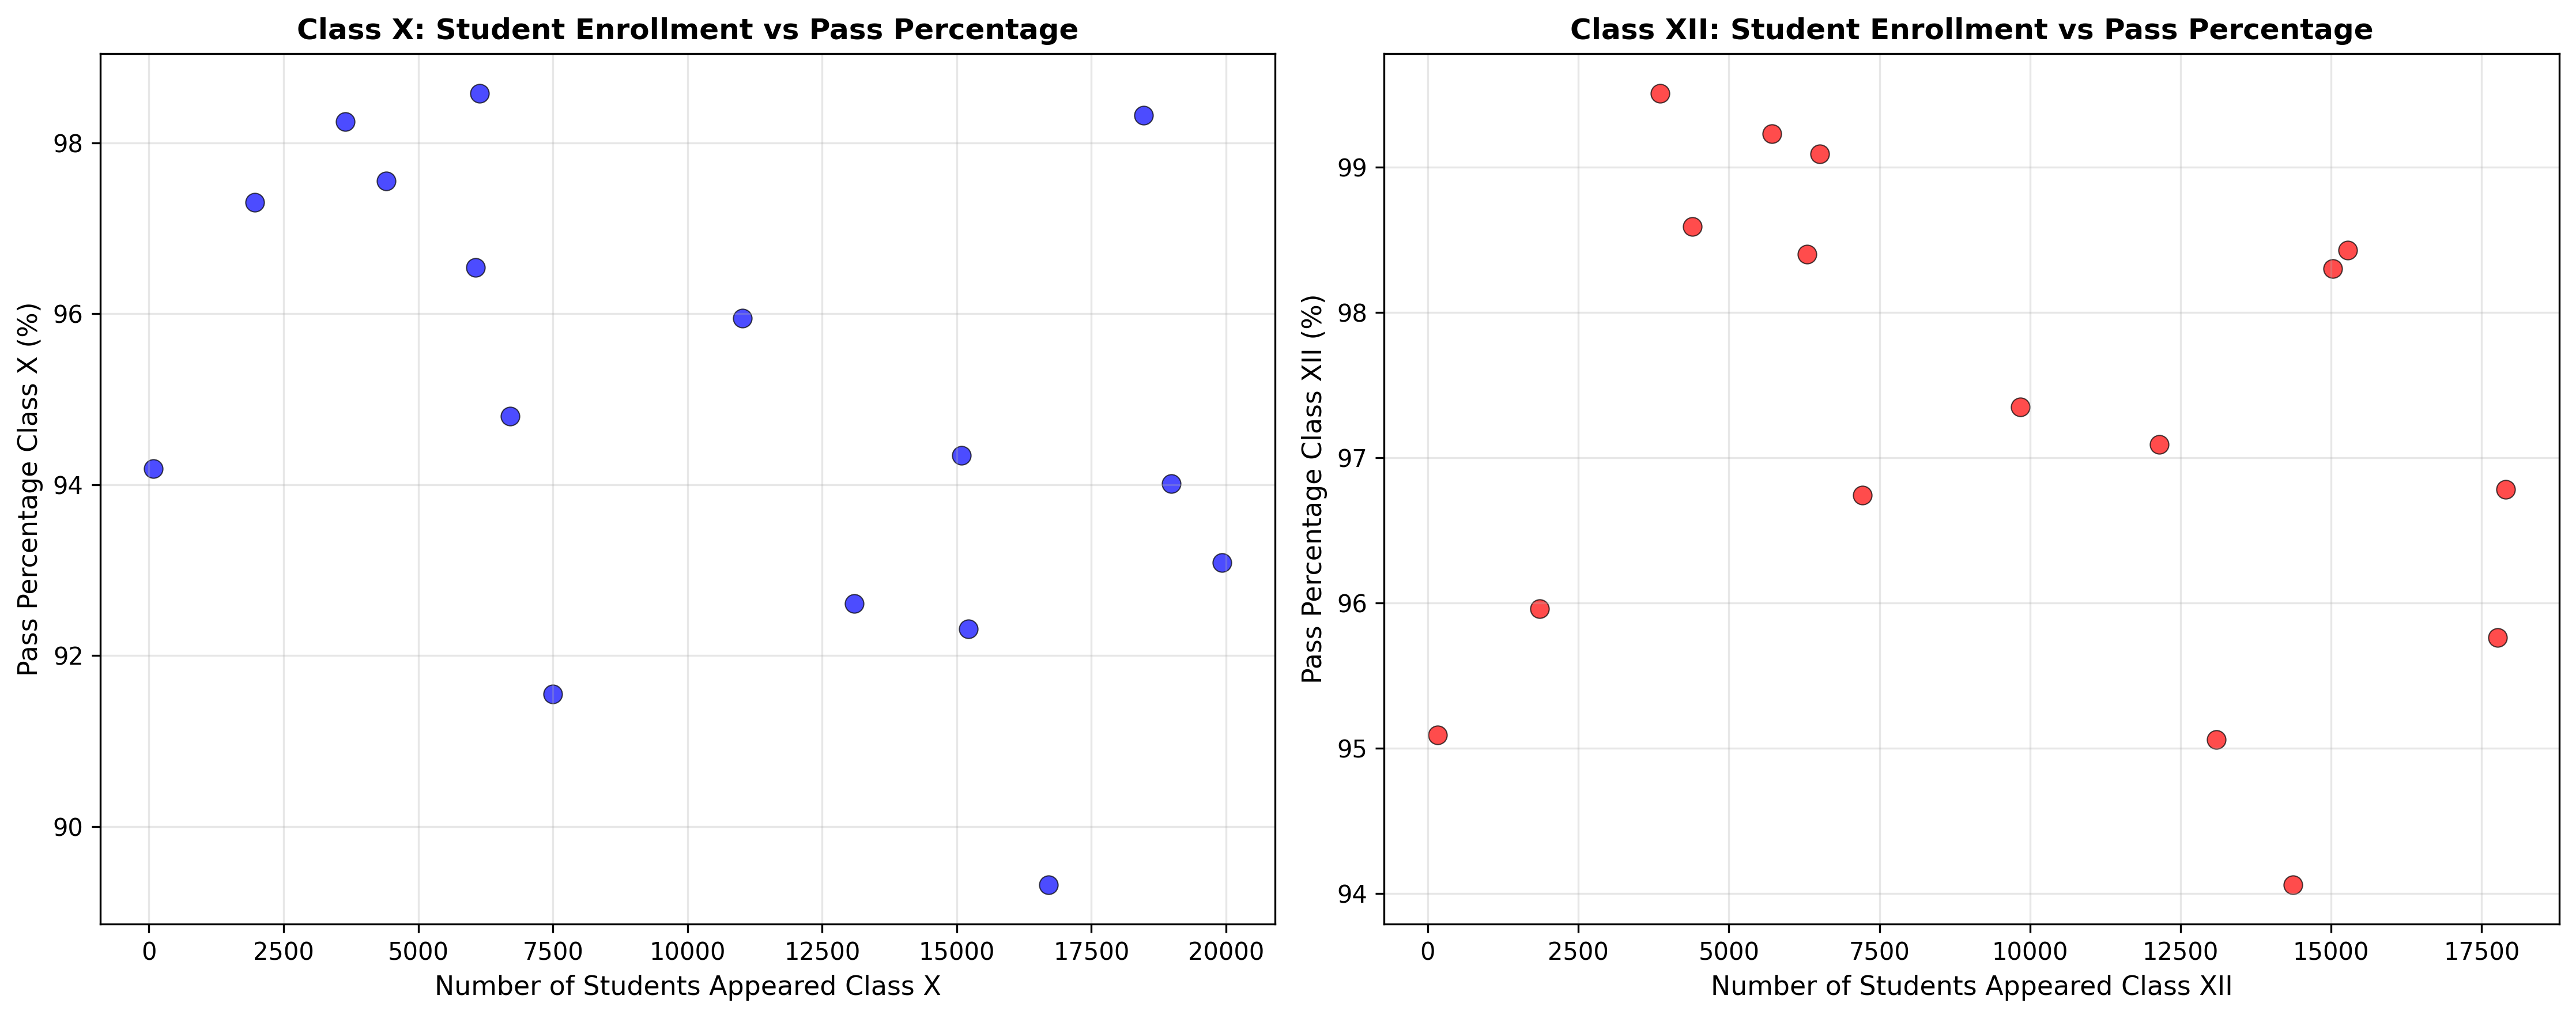
Findings:
- Negative correlation between enrollment size and pass percentage.
- Class X correlation: -0.437 (moderate negative).
- Class XII correlation: -0.227 (weak negative).
- Suggests possible resource strain in districts with high enrollments.
🔹 Box Plot — Distribution of Pass Percentages
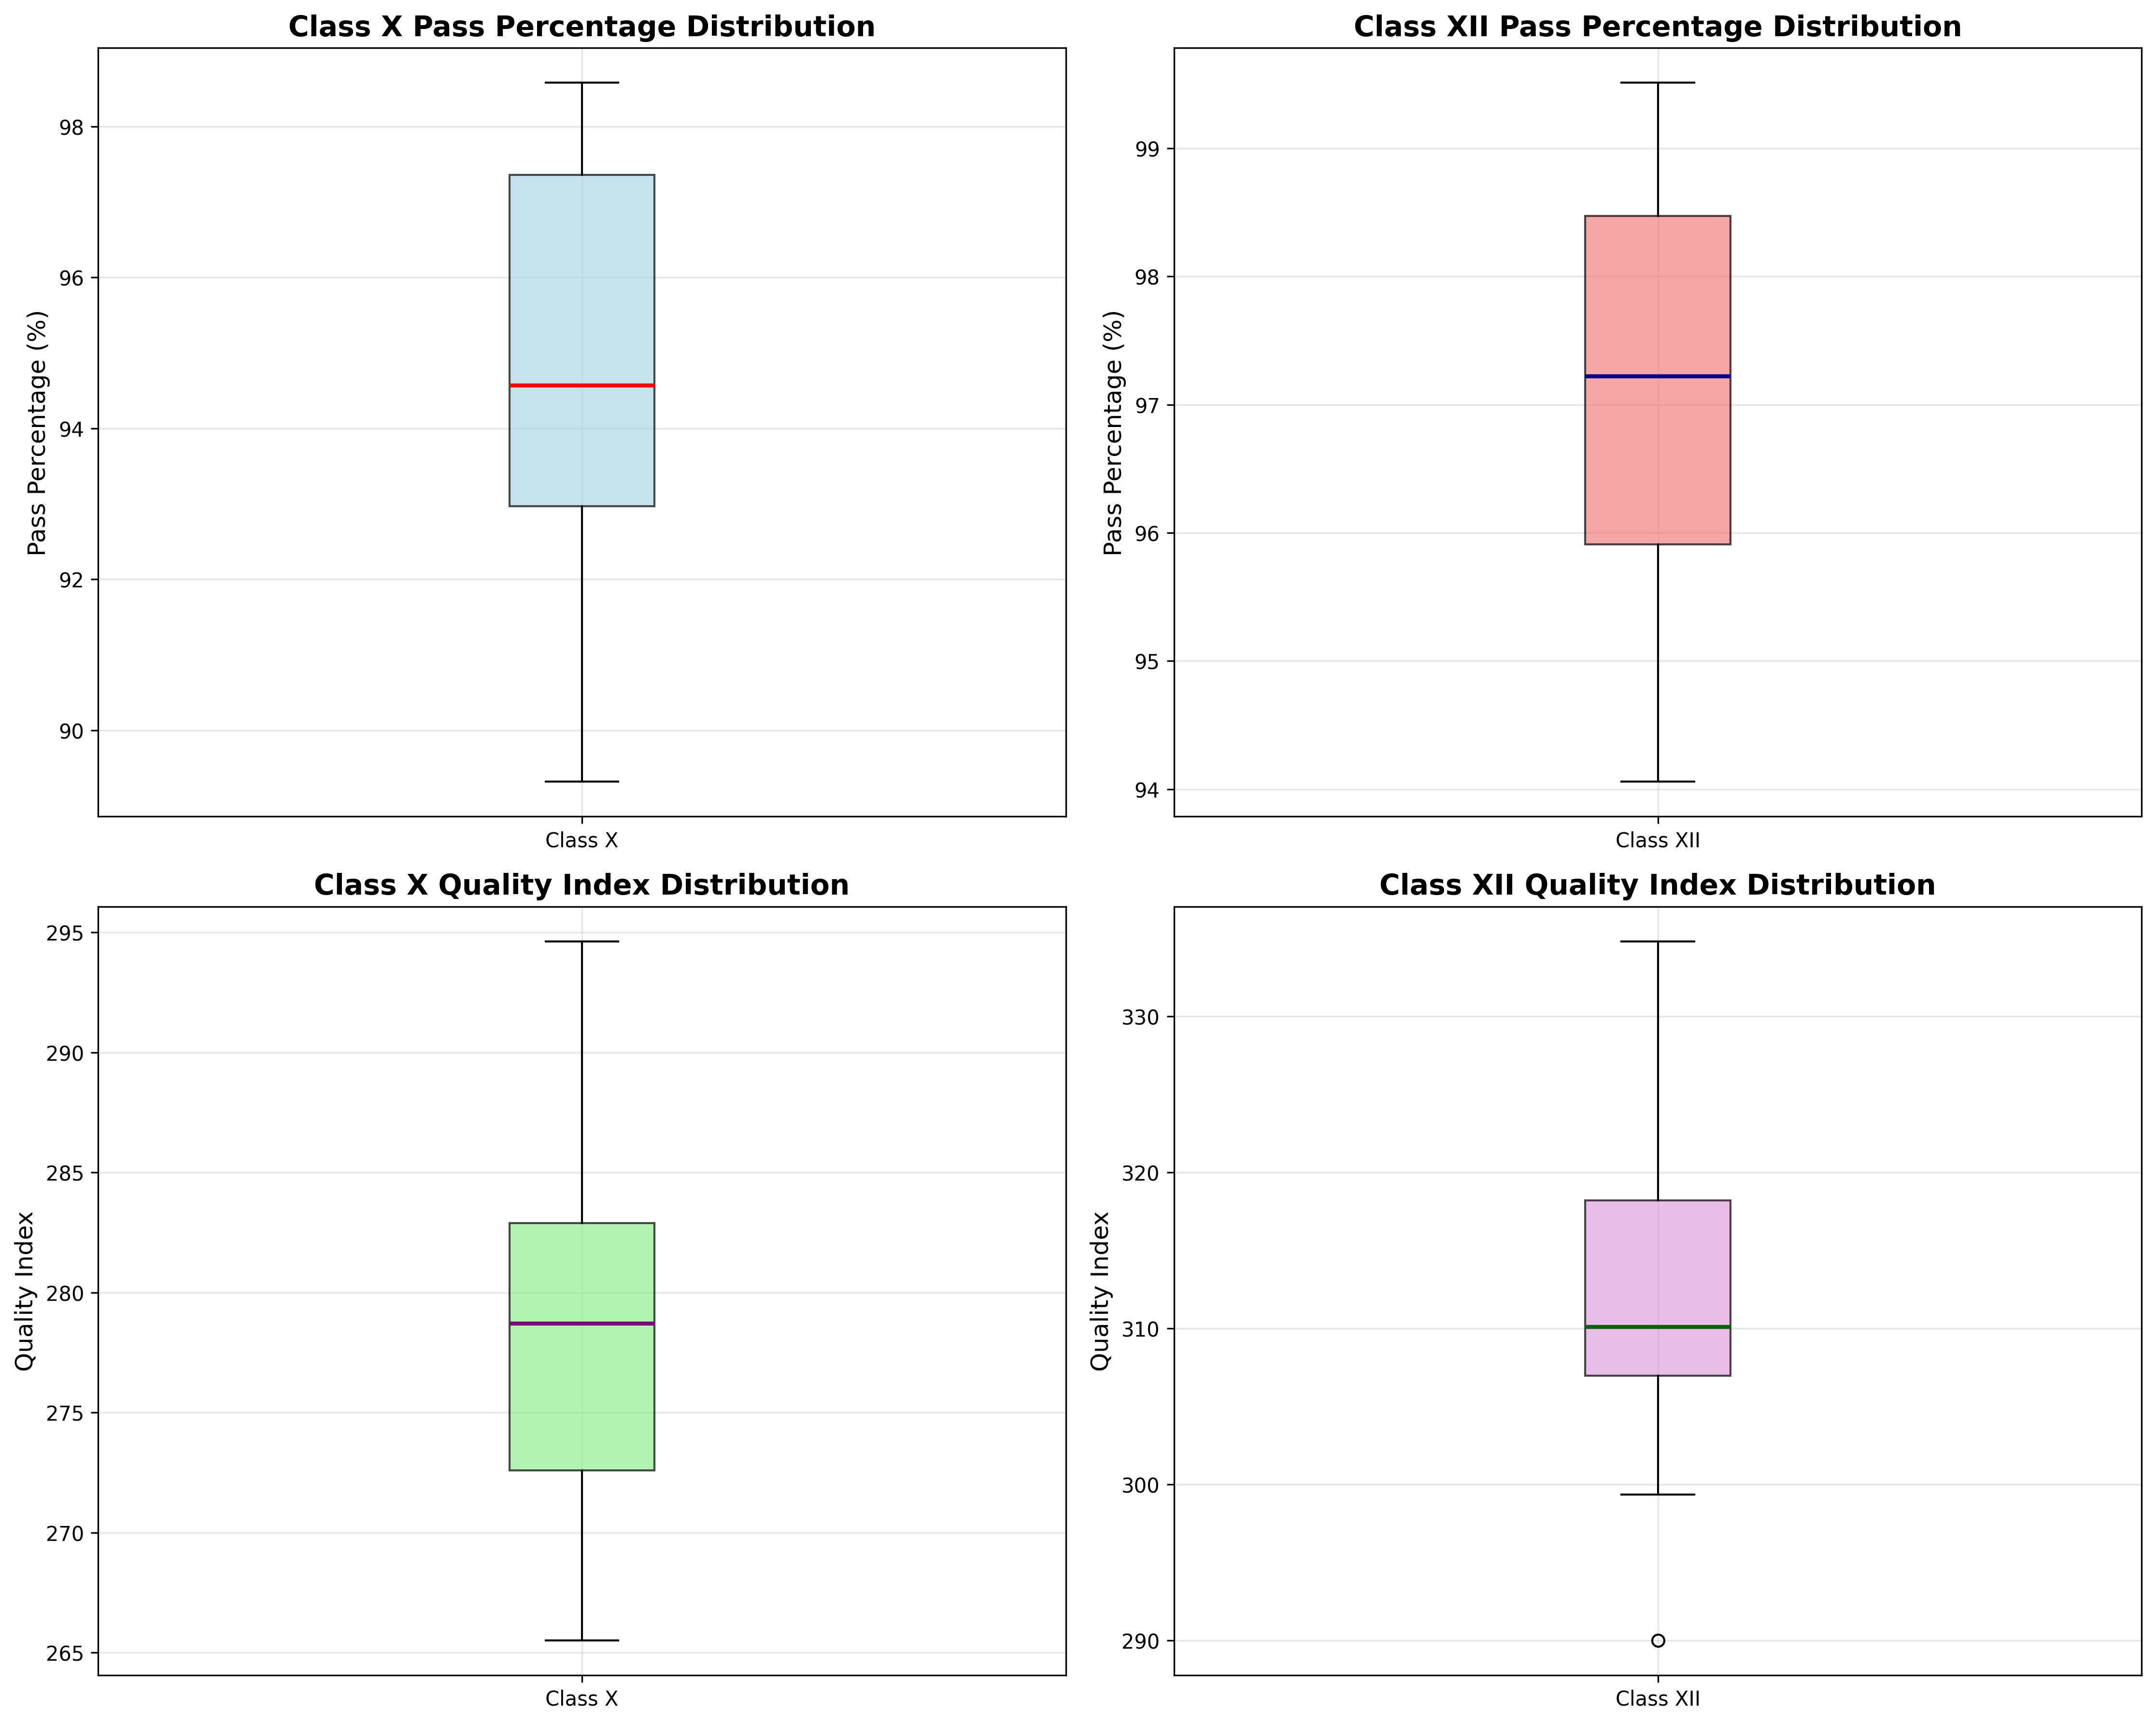
Findings:
- Class XII outperforms Class X (97.22% vs 94.92% average).
- Quality indices vary significantly across districts.
- One outlier district in Class XII’s quality index identified.
🔹 Bar & Line Plot — Schools and Enrollment by District
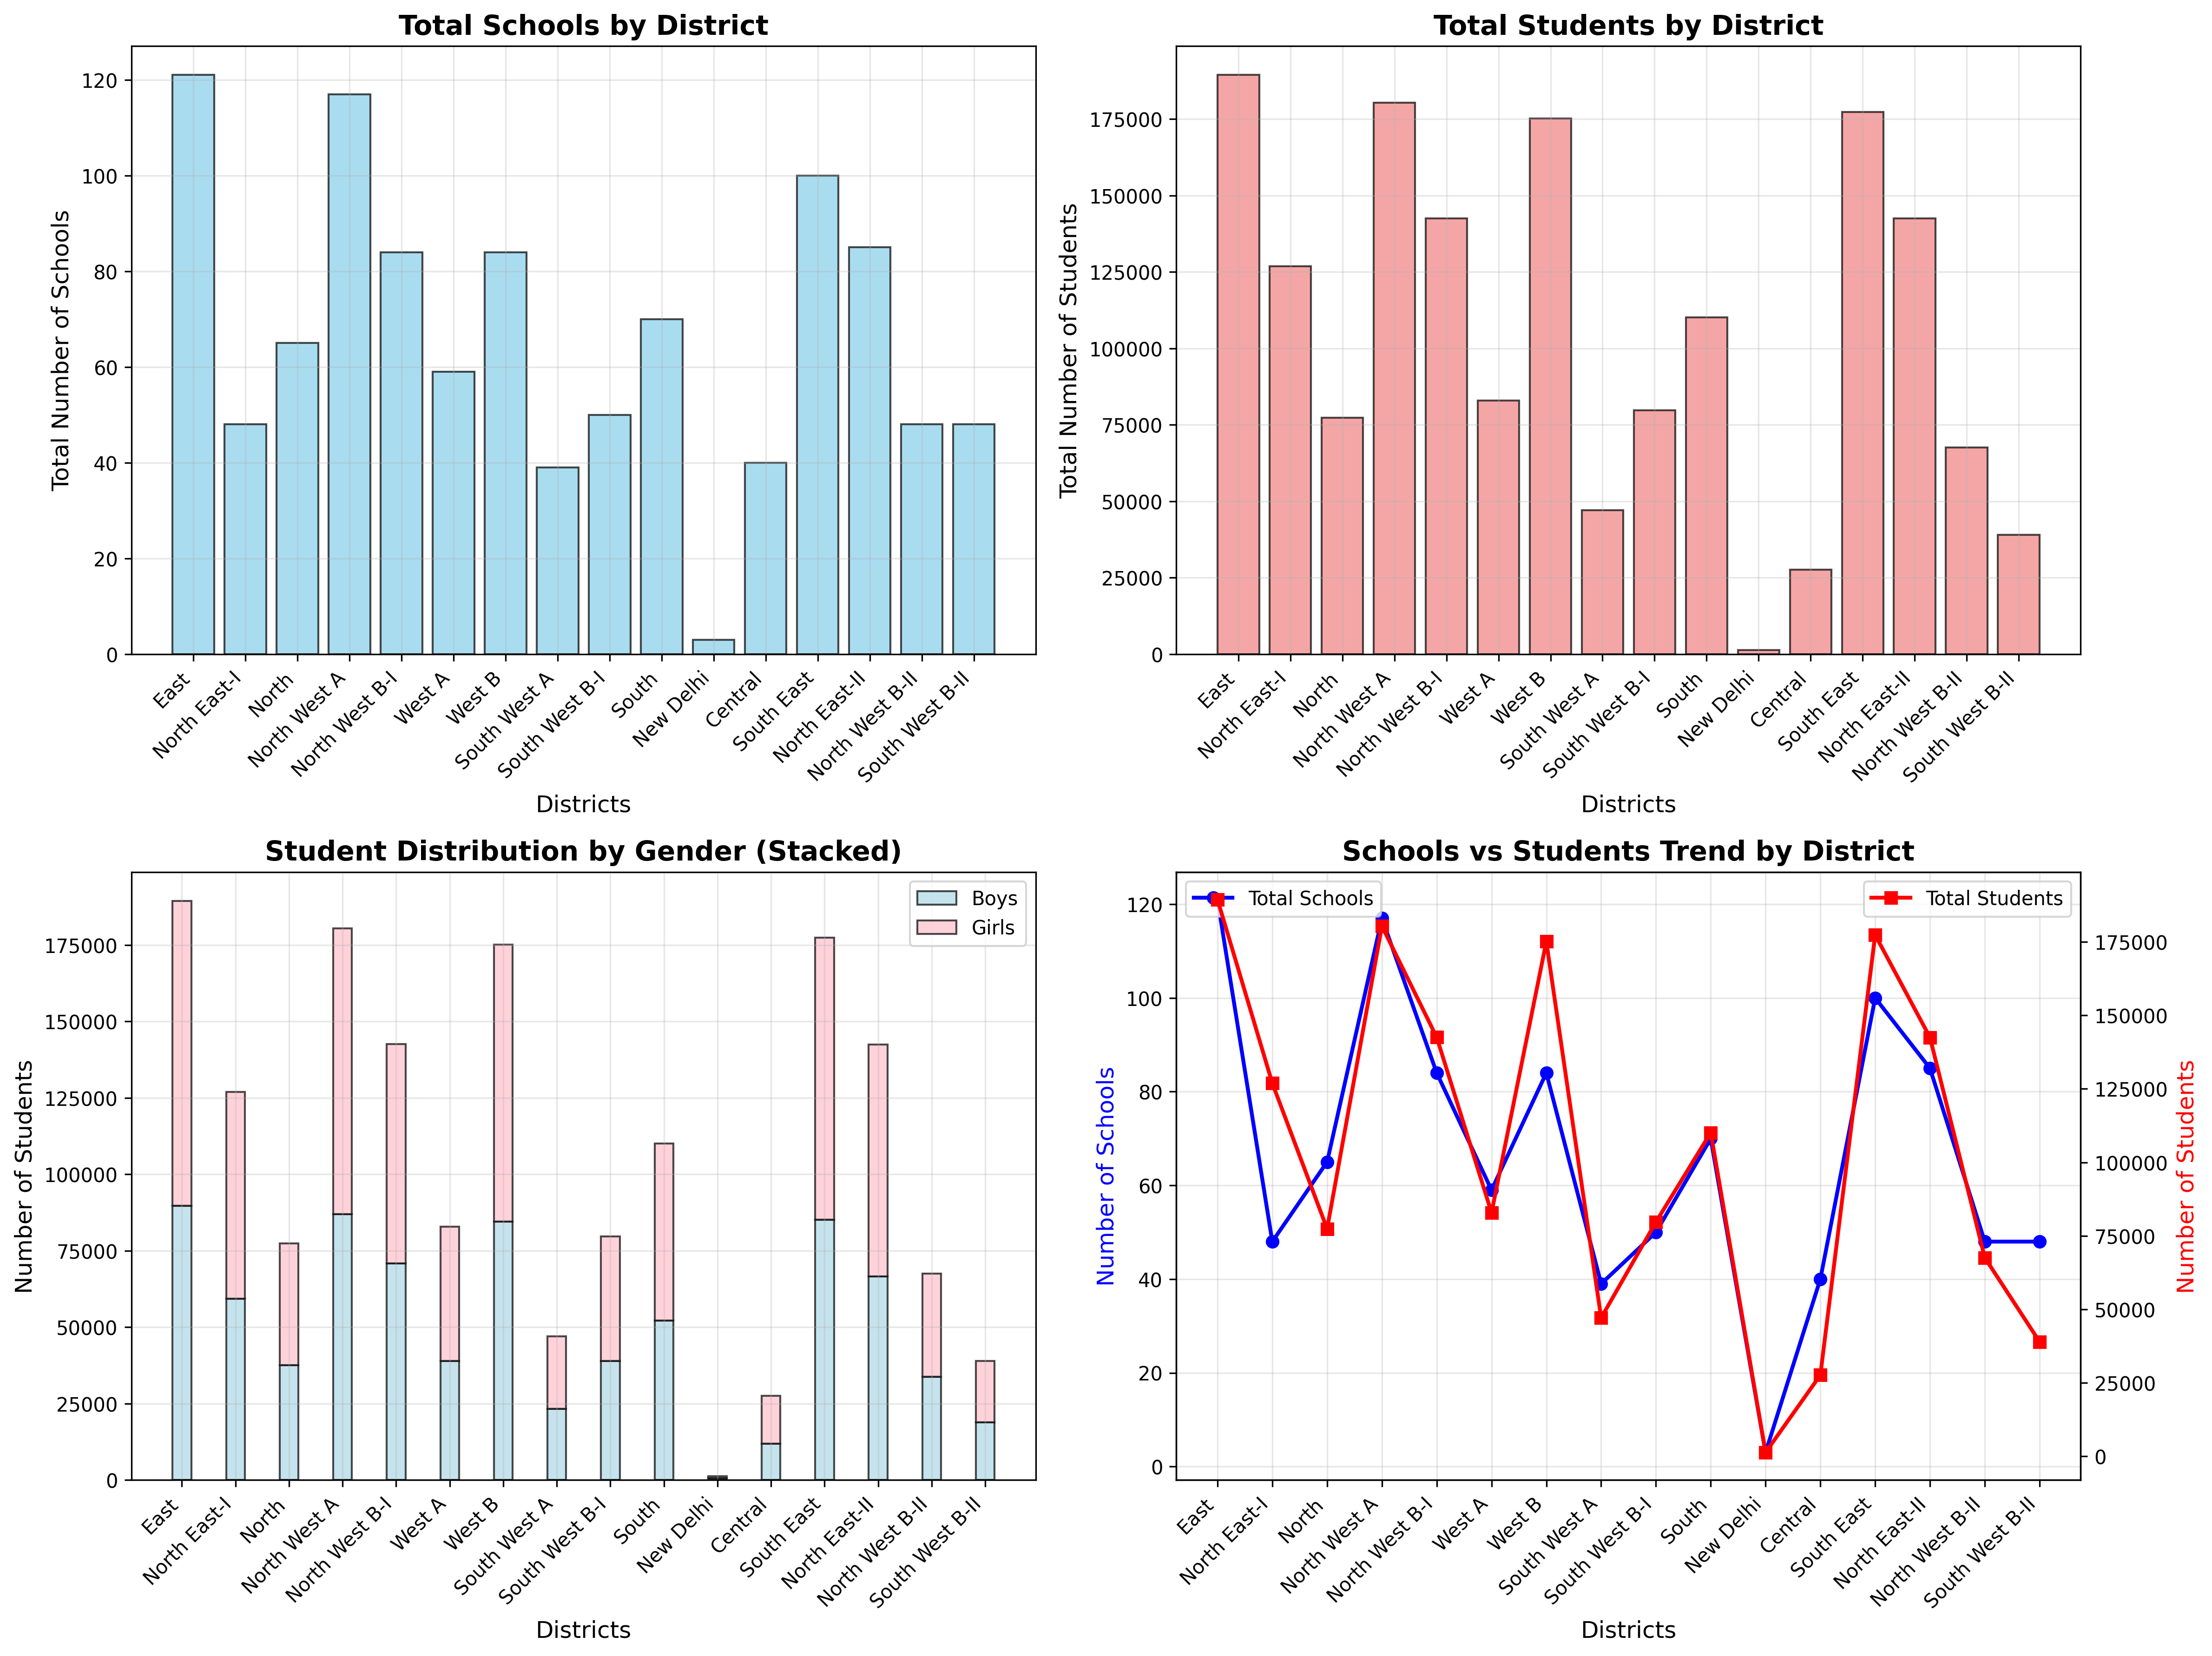
Findings:
- East District has the highest enrollment (189,406 students, 121 schools).
- Student-to-school ratios vary widely (432 to 2,644 students per school).
- Gender distribution remains relatively balanced across all districts.
🧐 Key Insights
🎓 Educational Performance
- High pass percentages overall (Class X: 89%+, Class XII: 94%+).
- Students improve from Class X → Class XII.
- Performance is stable across districts with few outliers.
🏫 Resource Distribution
- Large variation in student-to-school ratios.
- High-enrollment districts face overcrowding.
- Balanced gender ratios, but uneven infrastructure allocation.
🏛 Policy Implications
- Infrastructure Development → Prioritize districts with high student-to-school ratios.
- Quality Assurance → Investigate districts with performance outliers.
- Resource Optimization → Replicate strategies from high-performing districts.
📚 Citation
Government of India. (2024). District wise Number of Schools, Student Enrollment and Pass Percentage for Class X and XII in Delhi during 2023-2024.
Retrieved from data.gov.in.